Working with Lists
Now that we've established what a list is, let's talk about operations we can perform on it. Imagine a list as a deck of playing cards. A deck is the list and each playing card represents an item.

Photo by Christian Gidlöf
What queries can we make from the list? This accesses existing properties.
- Number of cards in the deck? 52.
- Number of suits? 4.
- Material? Paper.
- Length? 3.5" or 89mm.
- Width? 2.5" or 64mm.
What actions can we perform on the list? This changes the list based on a given operation.
- We can shuffle the deck.
- We can sort the deck by value.
- We can sort the deck by suit.
- We can split the deck.
- We can partition the deck by dealing out individual hands.
- We can select a specific card in the deck.
All of the operations listed above have analogous Dynamo nodes for working with lists of generic data. The lessons below will demonstrate some of the fundamental operations we can perform on lists.
List Operations
The image below is the base graph we will be using to demonstrate basic list operations. We'll explore how to manage data within a list and demonstrate the visual results.
Exercise - List Operations
Download the example file that accompanies this exercise (Right click and "Save Link As..."): List-Operations.dyn. A full list of example files can be found in the Appendix.
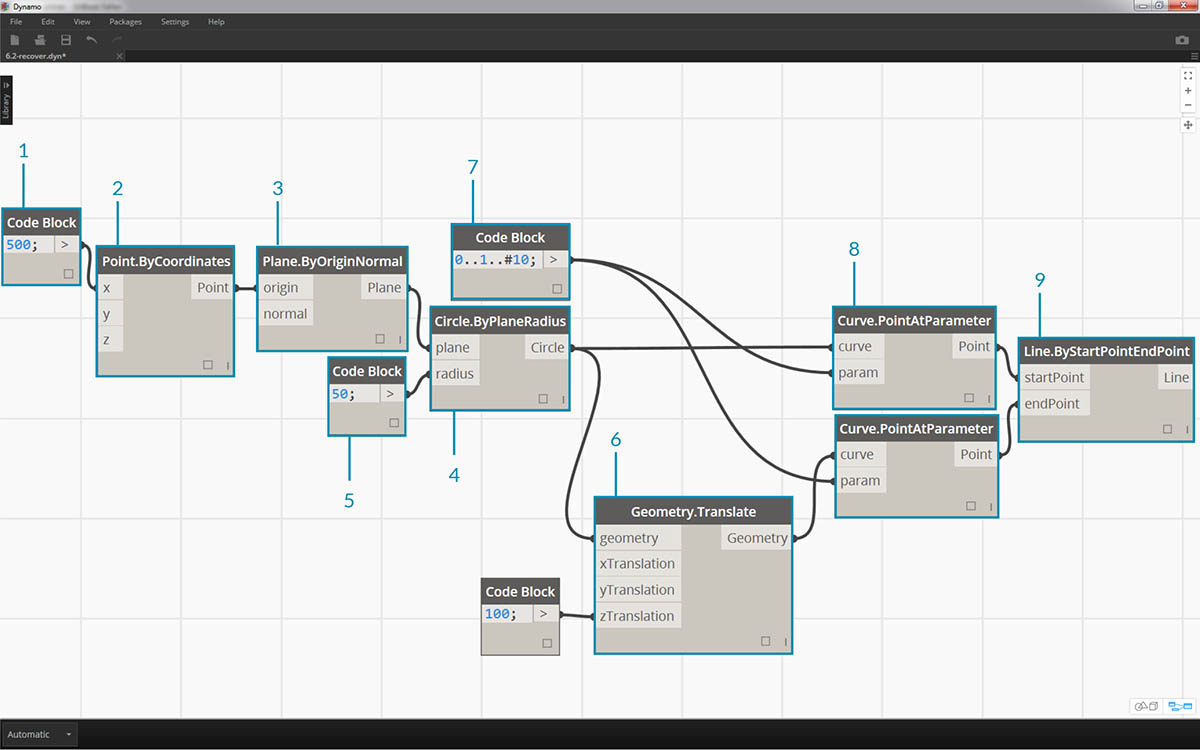
- Begin with a code block with a value of
500;- Plug into the x input of a Point.ByCoordinates node.
- Plug the node from the previous step into the origin input of a Plane.ByOriginNormal node.
- Using a Circle.ByPlaneRadius node, plug the node from the previous step into the plane input.
- Using code block, designate a value of
50;for the radius. This is the first circle we'll create.- With a Geometry.Translate node, move the circle up 100 units in the Z direction.
- With a code block node, define a range of ten numbers between 0 and 1 with this line of code:
0..1..#10;- Plug the code block from the previous step into the param input of two Curve.PointAtParameter nodes. Plug Circle.ByPlaneRadius into the curve input of the top node, and Geometry.Translate into the curve input of the node beneath it.
- Using a Line.ByStartPointEndPoint, connect the two Curve.PointAtParameter nodes.

- A Watch3D node shows the results of the Line.ByStartPointEndPoint. We are drawing lines between two circles to represent basic list operations and will use this base Dynamo graph to walk through the list actions below.
List.Count
The List.Count node is straightforward: it counts the number of values in a list and returns that number. This node gets more nuanced as we work with lists of lists, but we'll demonstrate that in the coming sections.
Exercise - List.Count
Download the example file that accompanies this exercise (Right click and "Save Link As..."): List-Count.dyn. A full list of example files can be found in the Appendix.
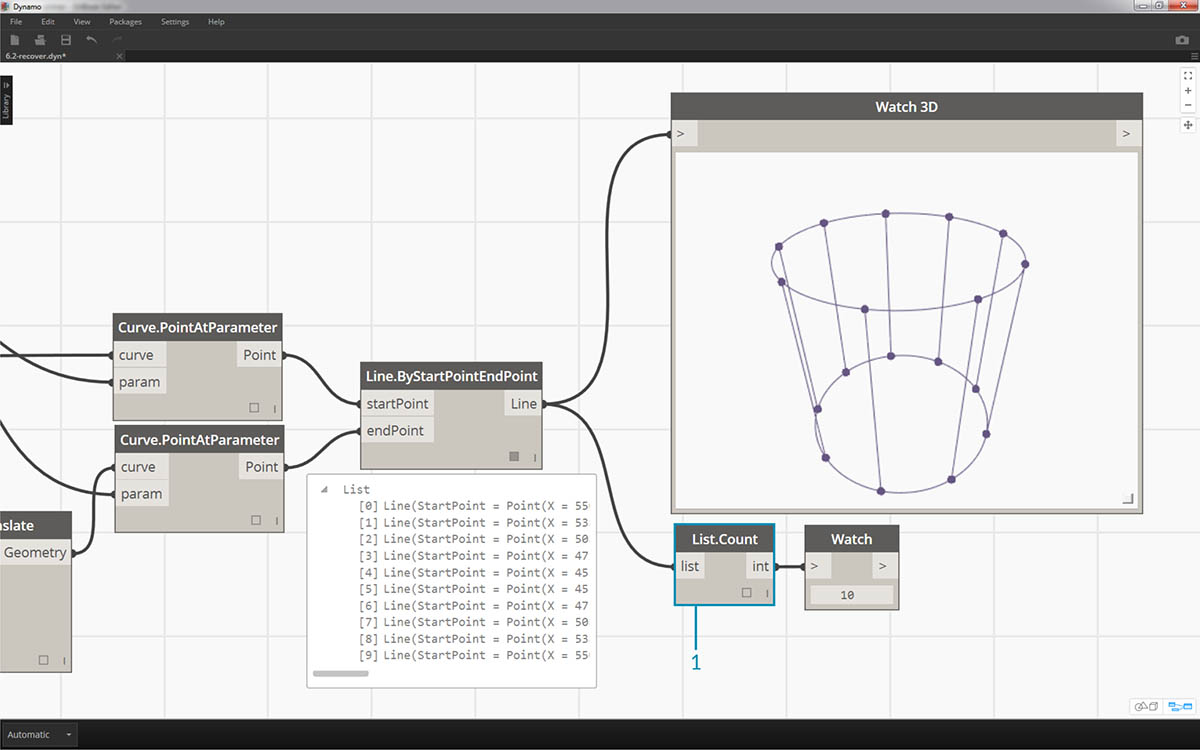
- The List.Count node returns the number of lines in the Line.ByStartPointEndPoint node. The value is 10 in this case, which agrees with the number of points created from the original code block node.
List.GetItemAtIndex
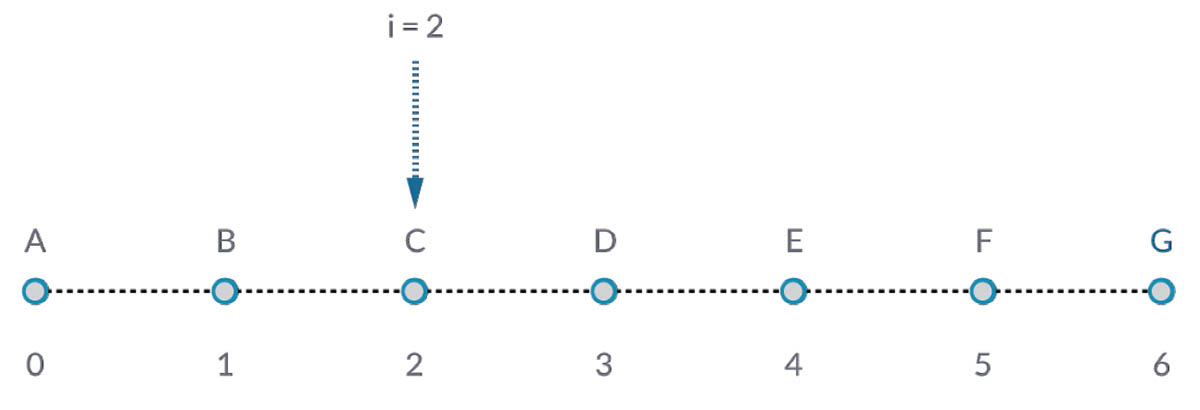
List.GetItemAtIndex is a fundamental way to query an item in the list. In the image above, we are using an index of "2" to query the point labeled "C".
Exercise - List.GetItemAtIndex
Download the example file that accompanies this exercise (Right click and "Save Link As..."): List-GetItemAtIndex.dyn. A full list of example files can be found in the Appendix.
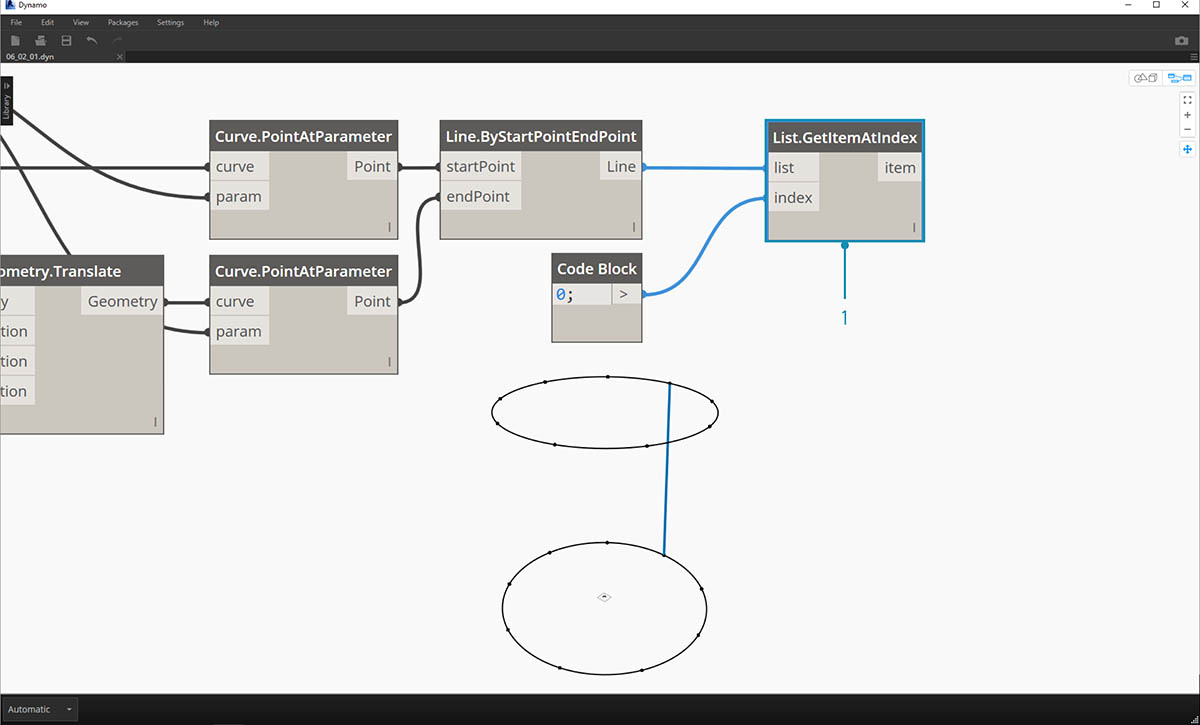
- Using the List.GetItemAtIndex node, we are selecting index "0", or the first item in the list of lines.
- The Watch3D node reveals that we've selected one line. Note: to get the image above, be sure to disable the preview of Line.ByStartPointEndPoint.
List.Reverse
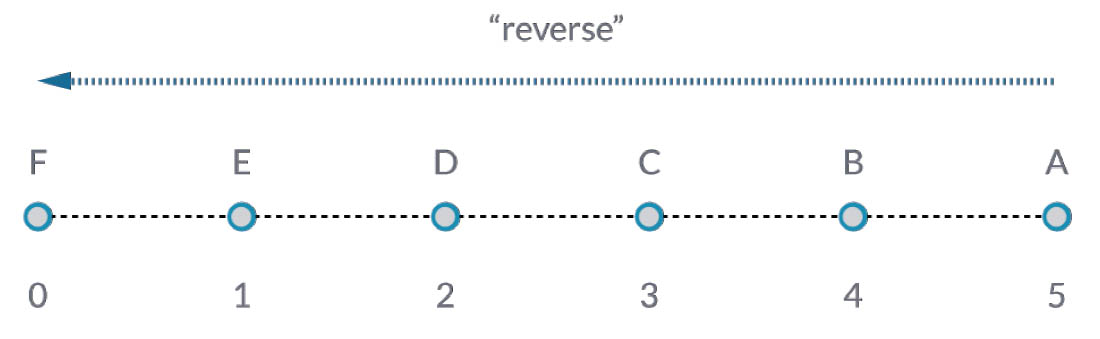
List.Reverse reverses the order of all of the items in a list.
Exercise - List.Reverse
Download the example file that accompanies this exercise (Right click and "Save Link As..."): List-Reverse.dyn. A full list of example files can be found in the Appendix.
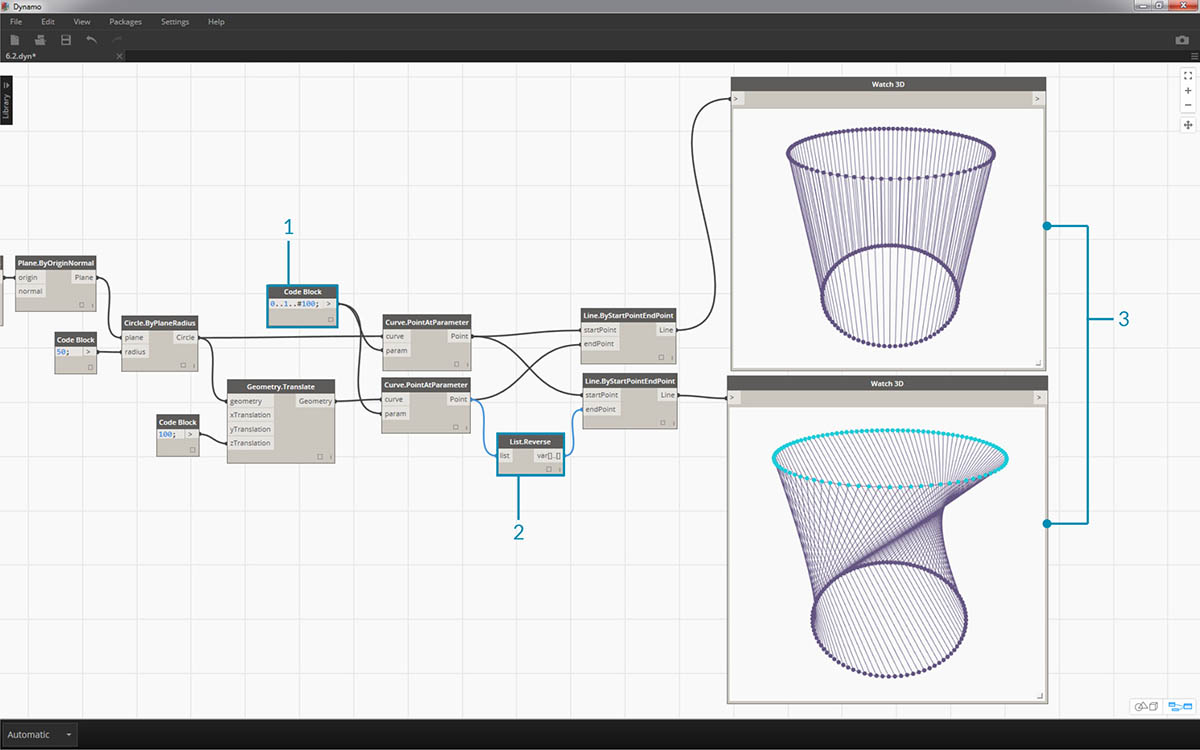
- To properly visualize the reversed list of lines, create more lines by changing the code block to
0..1..#100;- Insert a List.Reverse node in between Curve.PointAtParameter and Line.ByStartPointEndPoint for one of the list of points.
- The Watch3D nodes show two different results. The first one shows the result without a reversed list. The lines connect vertically to neighboring points. The reversed list, however, will connect all of the points to the opposing order in the other list.
List.ShiftIndices
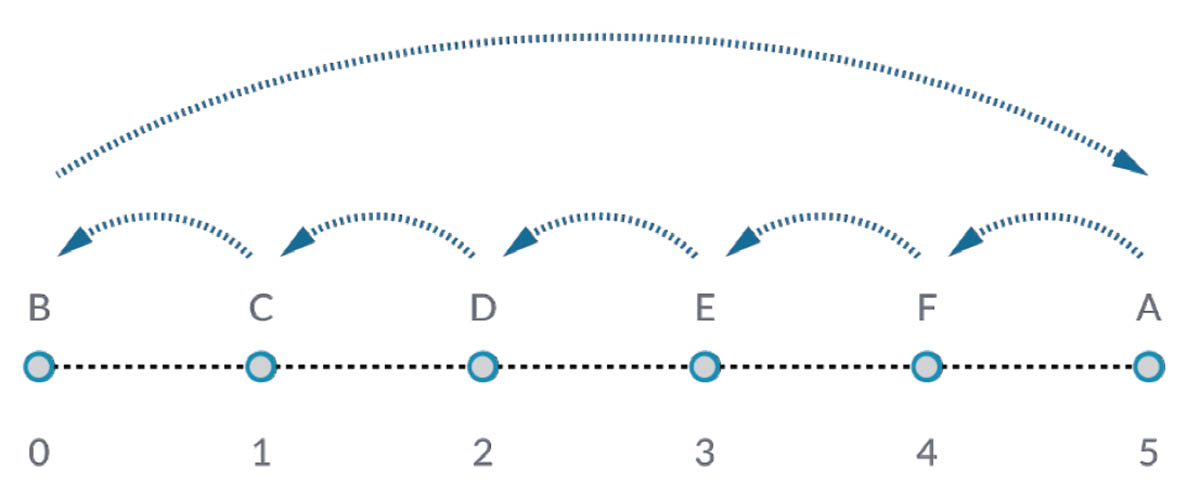
List.ShiftIndices is a good tool for creating twists or helical patterns, or any other similar data manipulation. This node shifts the items in a list a given number of indices.
Exercise - List.ShiftIndices
Download the example file that accompanies this exercise (Right click and "Save Link As..."): List-ShiftIndices.dyn. A full list of example files can be found in the Appendix.
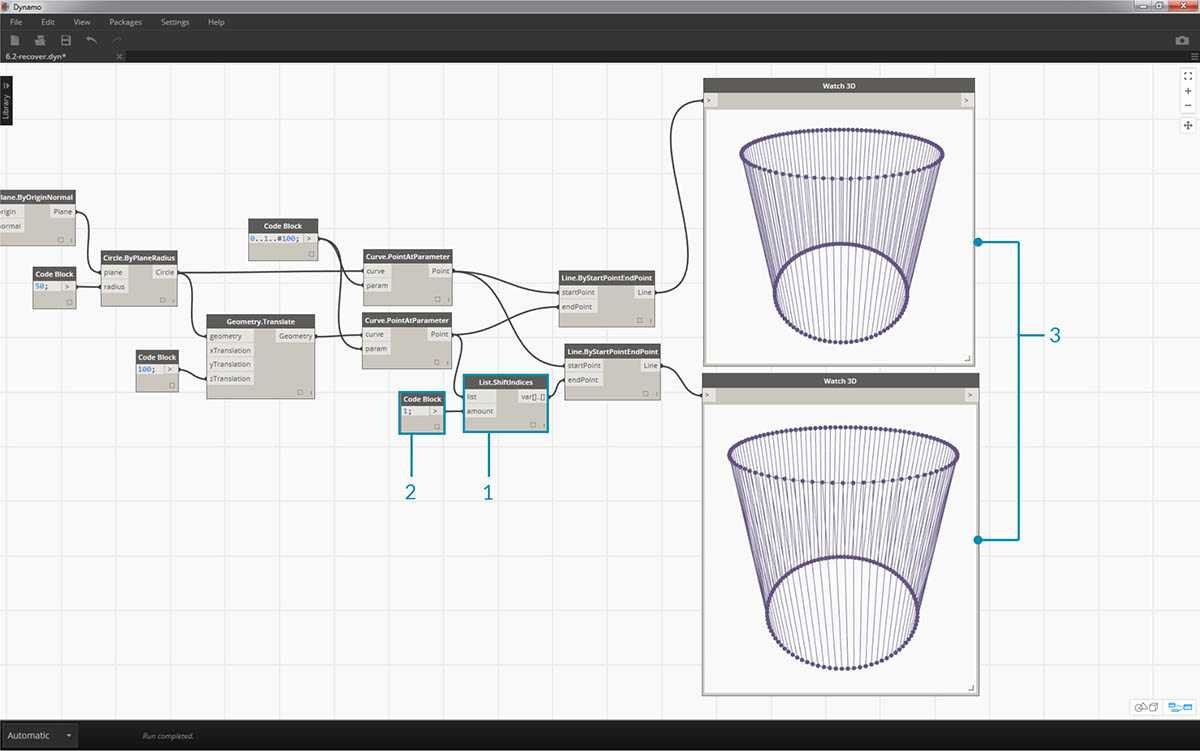
- In the same process as the reverse list, insert a List.ShiftIndices into the Curve.PointAtParameter and Line.ByStartPointEndPoint.
- Using a code block, designated a value of "1" to shift the list one index.
- Notice that the change is subtle, but all of the lines in the lower Watch3D node have shifted one index when connecting to the other set of points.
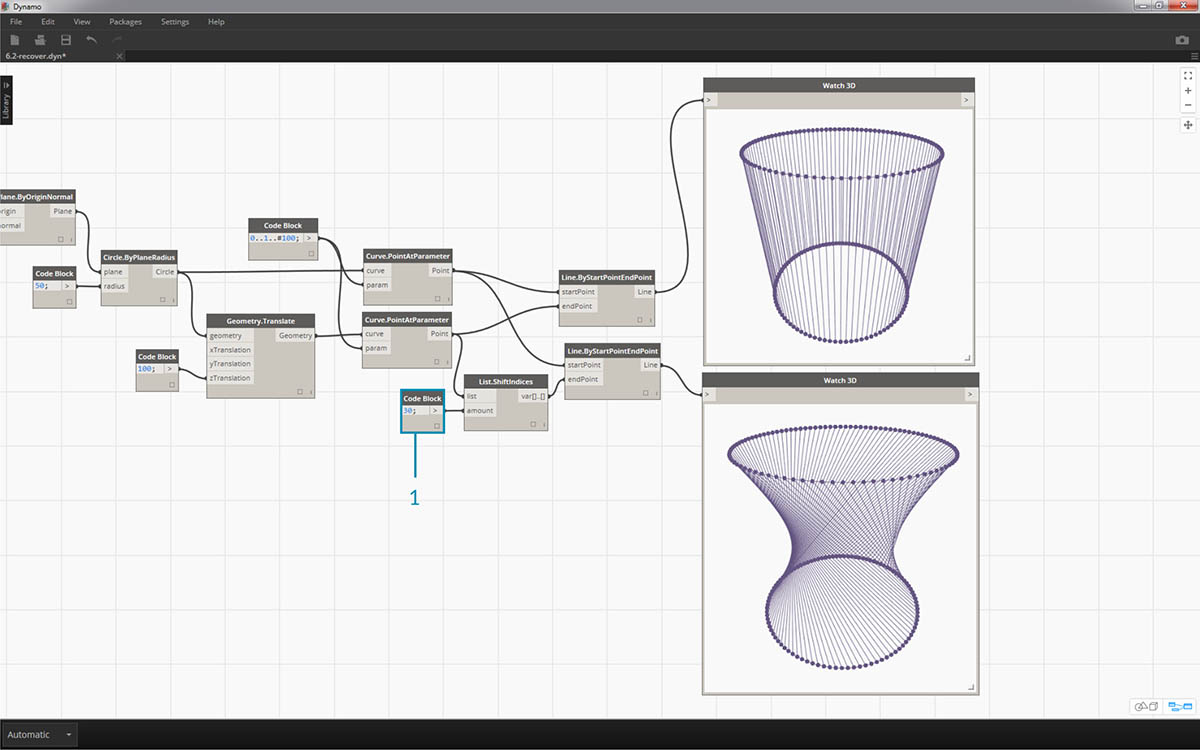
- By changing to code block to a larger value, "30" for example, we notice a significant difference in the diagonal lines. The shift is working like a camera's iris in this case, creating a twist in the original cylindrical form.
List.FilterByBooleanMask
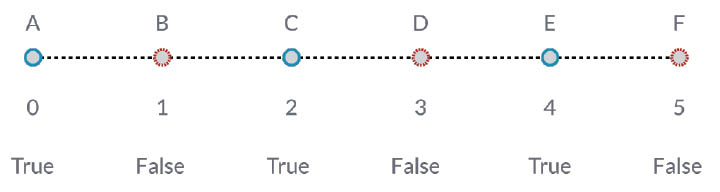
List.FilterByBooleanMask will remove certain items based on a list of booleans, or values reading "true" or "false".
Exercise - List.FilterByBooleanMask
Download the example file that accompanies this exercise (Right click and "Save Link As..."): List-FilterByBooleanMask.dyn. A full list of example files can be found in the Appendix.
In order to create a list of values reading "true" or "false", we need to a little more work...
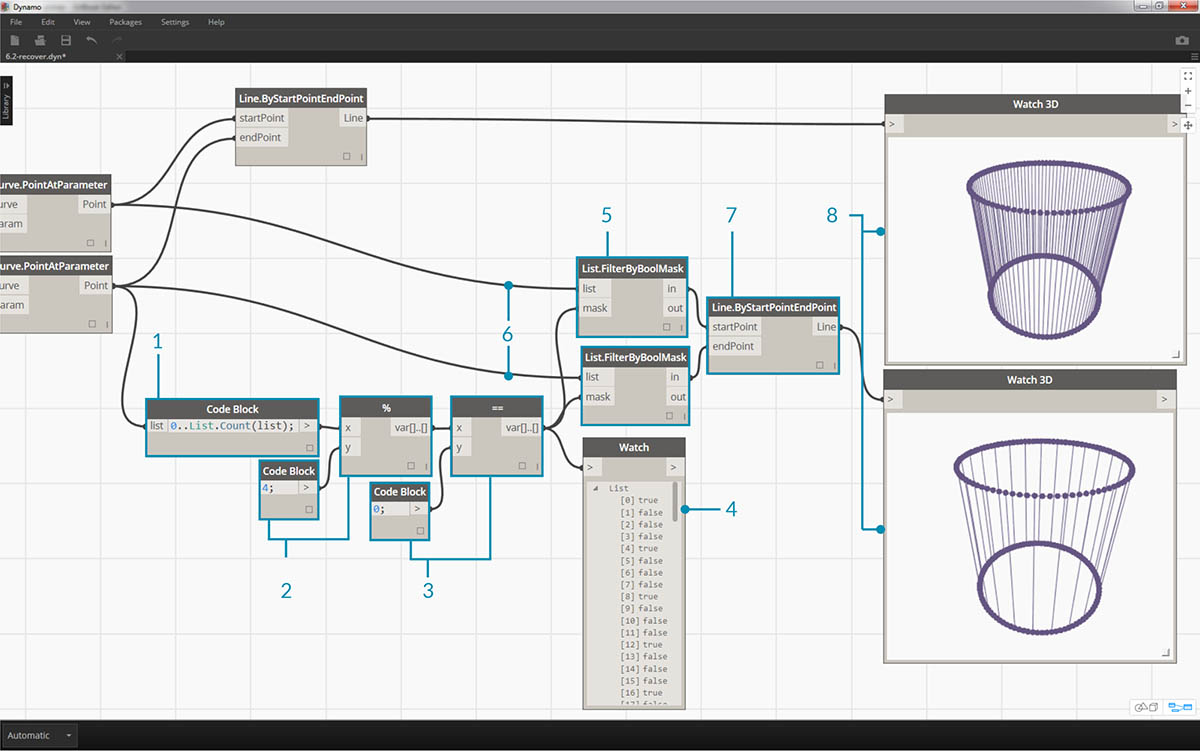
- Using a code block, define an expression with the syntax:
0..List.Count(list);. Connect the Curve.PointAtParameter node to the list input. We'll walk through this setup more in the code block chapter, but the line of code in this case is giving us a list representing each index of the Curve.PointAtParameter node.- Using a "%" (modulus) node, connect the output of the code block into the x input, and a value of 4 into the y input. This will give us the remainder when dividing the list of indices by 4. Modulus is a really helpful node for pattern creation. All values will read as the possible remainders of 4: 0, 1, 2, 3.
- From the modulus node, we know that a value of 0 means that the index is divisible by 4 (0,4,8,etc...). By using a "==" node, we can test for the divisibility by testing it against a value of "0".
- The Watch node reveals just this: we have a true/false pattern which reads: true,false,false,false....
- Using this true/false pattern, connect to the mask input of two List.FilterByBooleanMask nodes.
- Connect the Curve.PointAtParameter node into each list input for the List.FilterByBooleanMask.
- The output of Filter.ByBooleanMask reads "in" and "out". "In" represents values which had a mask value of "true" while "out" represents values which had a value of "false". By plugging the "in" outputs into the startPoint and endPoint inputs of a Line.ByStartPointEndPoint node, we've created a filtered list of lines.
- The Watch3D node reveals that we have fewer lines than points. We've selected only 25% of the nodes by filtering only the true values!